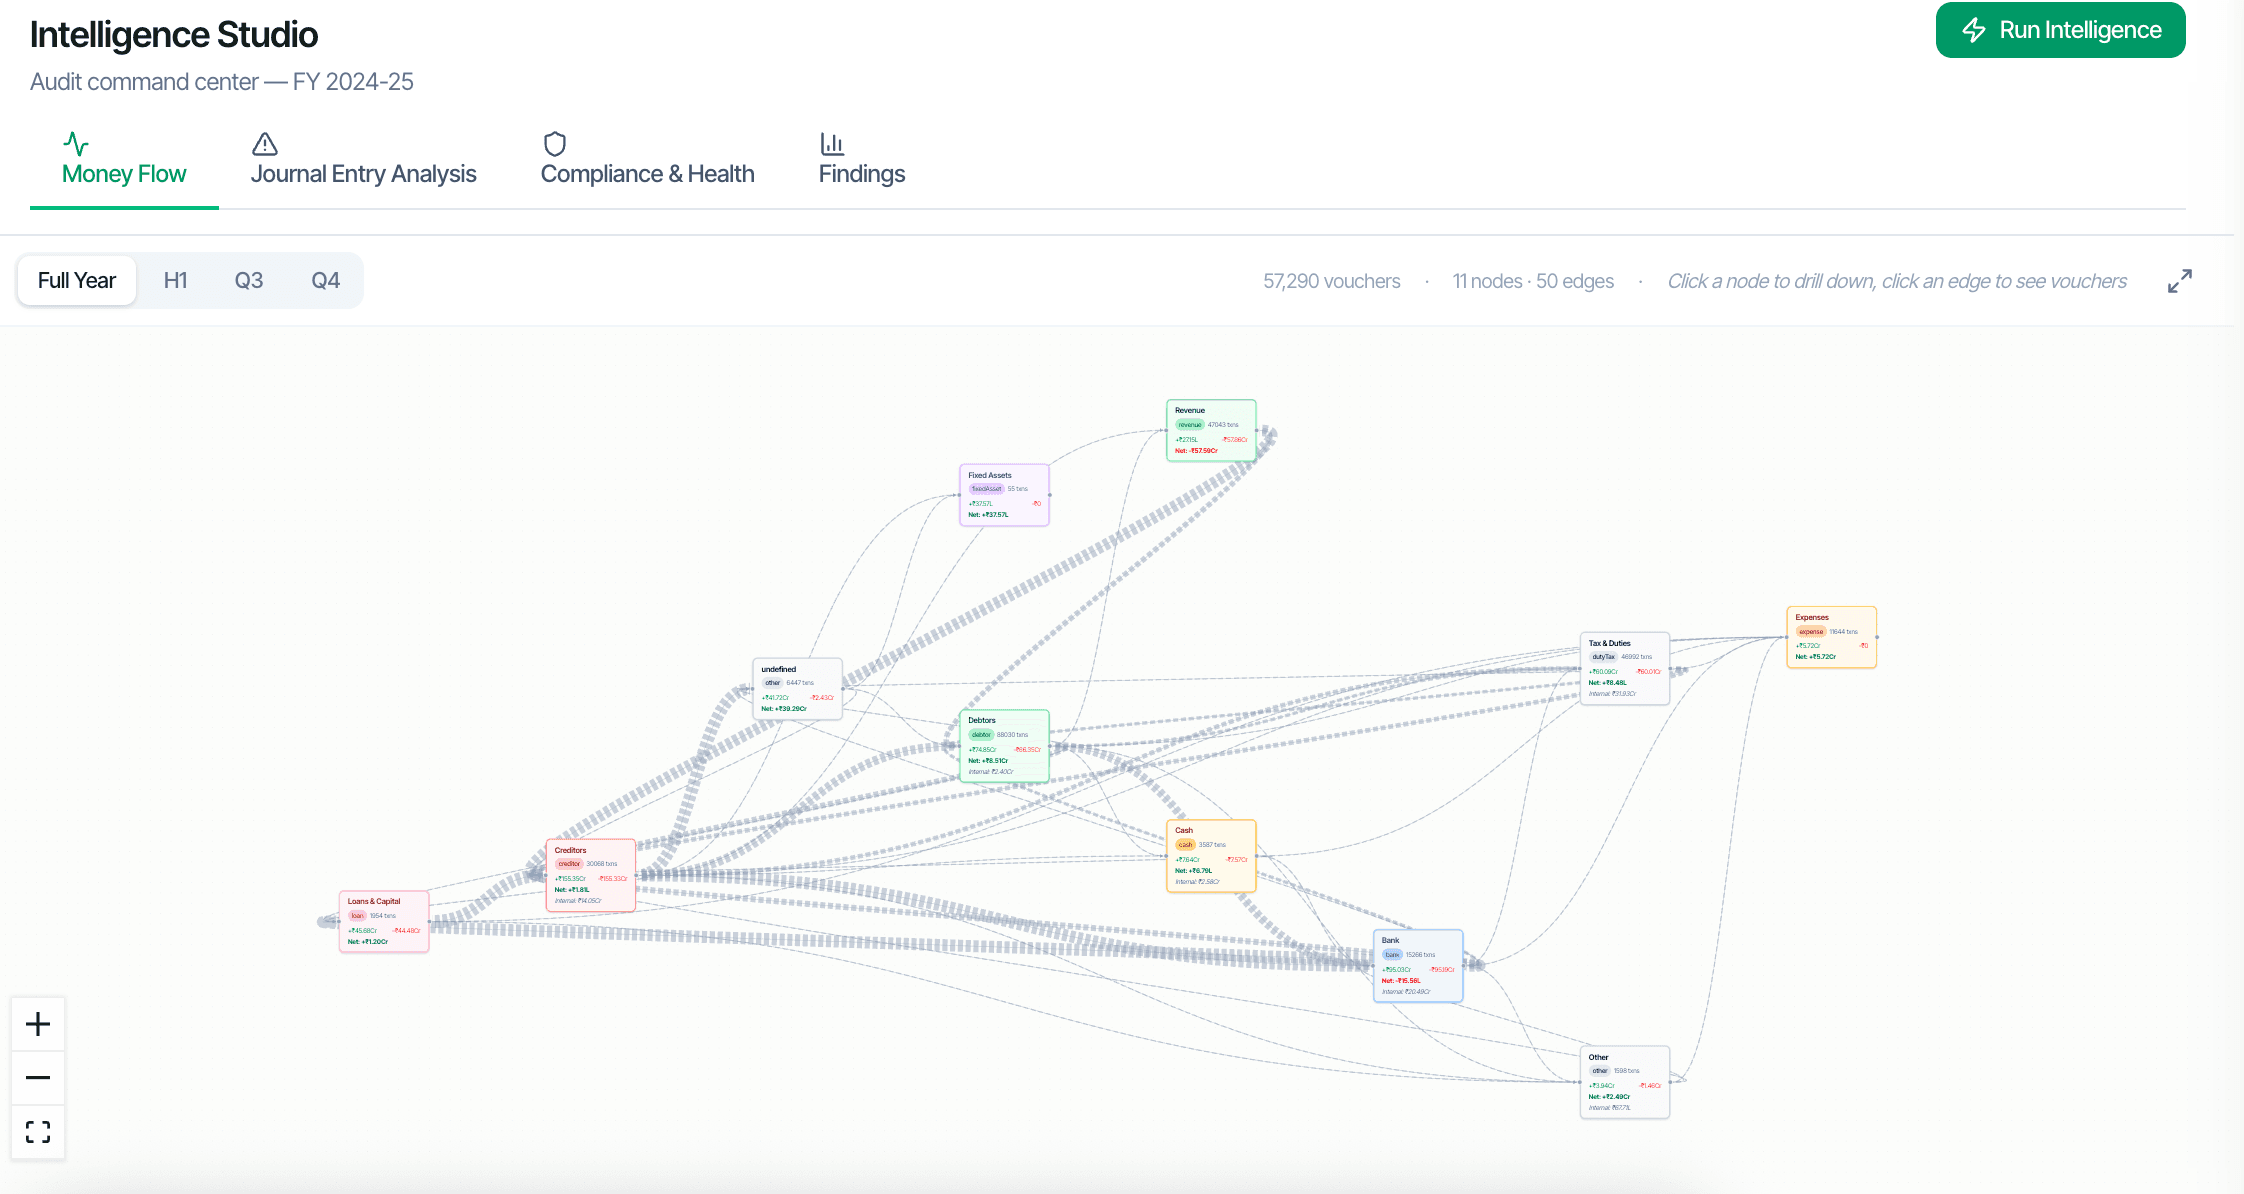
Auditors don't think in tables; they think in relationships. The Intelligence workspace shows where the money actually went: a ₹-weighted flow graph of the entity's ledgers and parties, an Executive view of the engagement's vitals, and a Business DNA read of how this client actually operates — every figure computed from the vouchers, nothing re-derived.
Two paths to the same audit conclusion. One leaves traces; the other doesn't.
Shows the dominant money flows across the entity as a ₹-weighted graph — top suppliers by outflow, top customers by inflow, the paths between them. A Sankey view and a cash waterfall re-read the same nodes and edges, so the three lenses can never disagree.
The engagement's vitals in one view — the headline financials, movements and flags an engagement partner wants before opening a single working paper.
A profile of how this client actually operates — the patterns in its trading, seasonality and counterparties, computed from the books and comparable across years.
Every node and edge drills to the ledgers, parties and vouchers behind it — the graph is a navigation surface over the books, not a picture.
Nodes are ledgers and parties; edges are aggregated vouchers between them, weighted by rupee value. The flow graph tolerates the messiness of real books — Cash and Bank contra flows, back-edges — rather than forcing a clean hierarchy.
Click any node to drill into that ledger's transactions or that party's voucher list. Click any edge to see the specific vouchers between two parties.
The digraph, the Sankey and the cash waterfall all read the same server-computed nodes-and-links payload. Nothing is re-derived per view, so the numbers agree by construction.
Every figure in the Intelligence workspace traces to the vouchers that produced it, in line with the engagement's SA 230 documentation trail.